Count everyone.
Store no one.
Turn any doorway, screen or camera into a measurement point. Count real footfall, then understand who your audience is — age band, attention and dwell — always anonymously, always on the device.
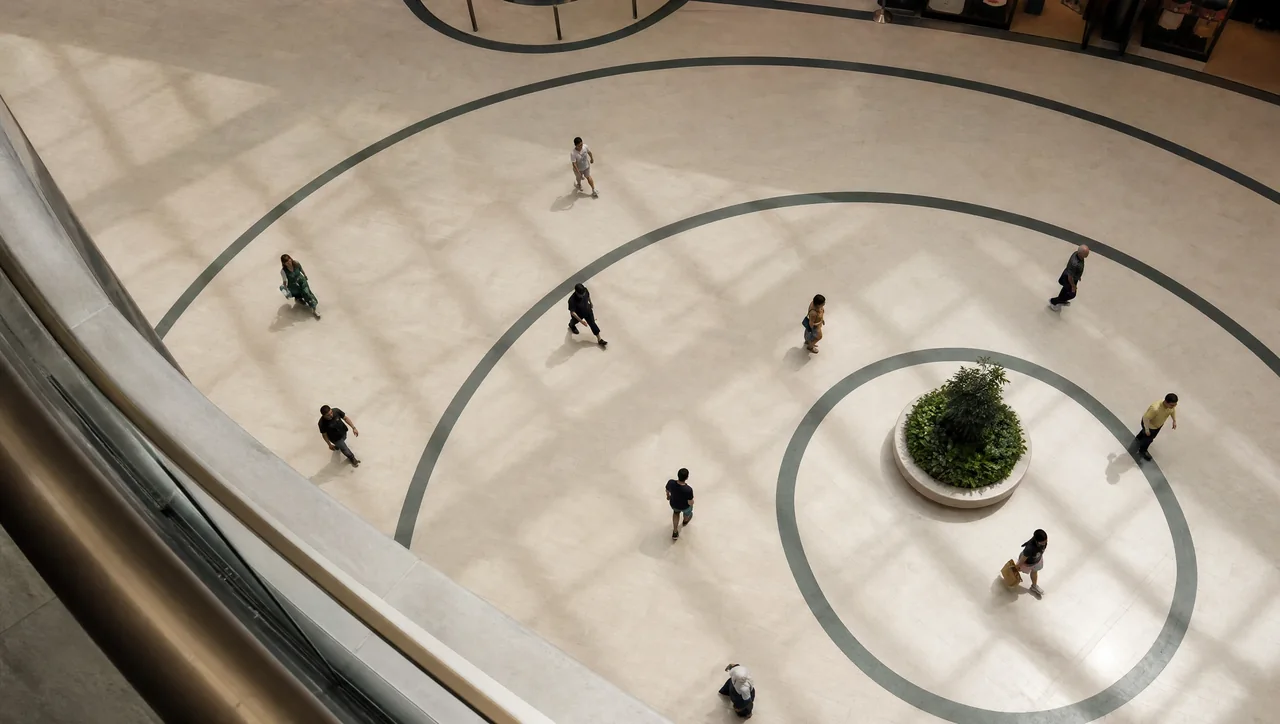
Know your real footfall — hourly and peak
Accurate in / out counting at every entrance, with hourly and peak dashboards per site, and live occupancy by count. Works with a screen, or sensor-only where there's no display to trigger content on.
- In / out counting, hourly & peak
- Occupancy by count with capacity gauge
- Works sensor-only or screen-adjacent
- CSV export & branded PDF
Understand who — without ever knowing who
Anonymous age band and gender, attention and dwell time — the silhouette becomes a number the instant it's seen. No face is stored, matched or recognised. Ever.
- Age band & gender, aggregate only
- Attention rate & average dwell
- Anonymous silhouettes → charts
- Processed on-device, images discarded
retained 0 frames · 0 faces · 0 anonymous numbers
Play the right content for who's in front of it
Detect the audience and trigger the matching content on your screen — then pipe the numbers into whatever you already use through our feed and API. We measure and trigger; your CMS still plays.
- Trigger content by audience or vehicle
- Feed / API into your CMS & your own tools
- Never replaces your CMS — enriches it
One sensor tells you how many. A sensor per area tells you the journey.
Put a sensor in each area — entrance, every aisle, checkout — and each one reports its own reach, dwell, age % and gender %. Group the areas into stages and the dashboard maps your whole venue's traffic, switchable by reach, gender, age or dwell. Aggregate areas only — never individual paths.
proportional distribution across your stages — relative volume, not measured paths
See who's really there.
Book a demo, or get in touch.
No faces stored · Edge-processed on-device · GDPR-ready · Cancel anytime